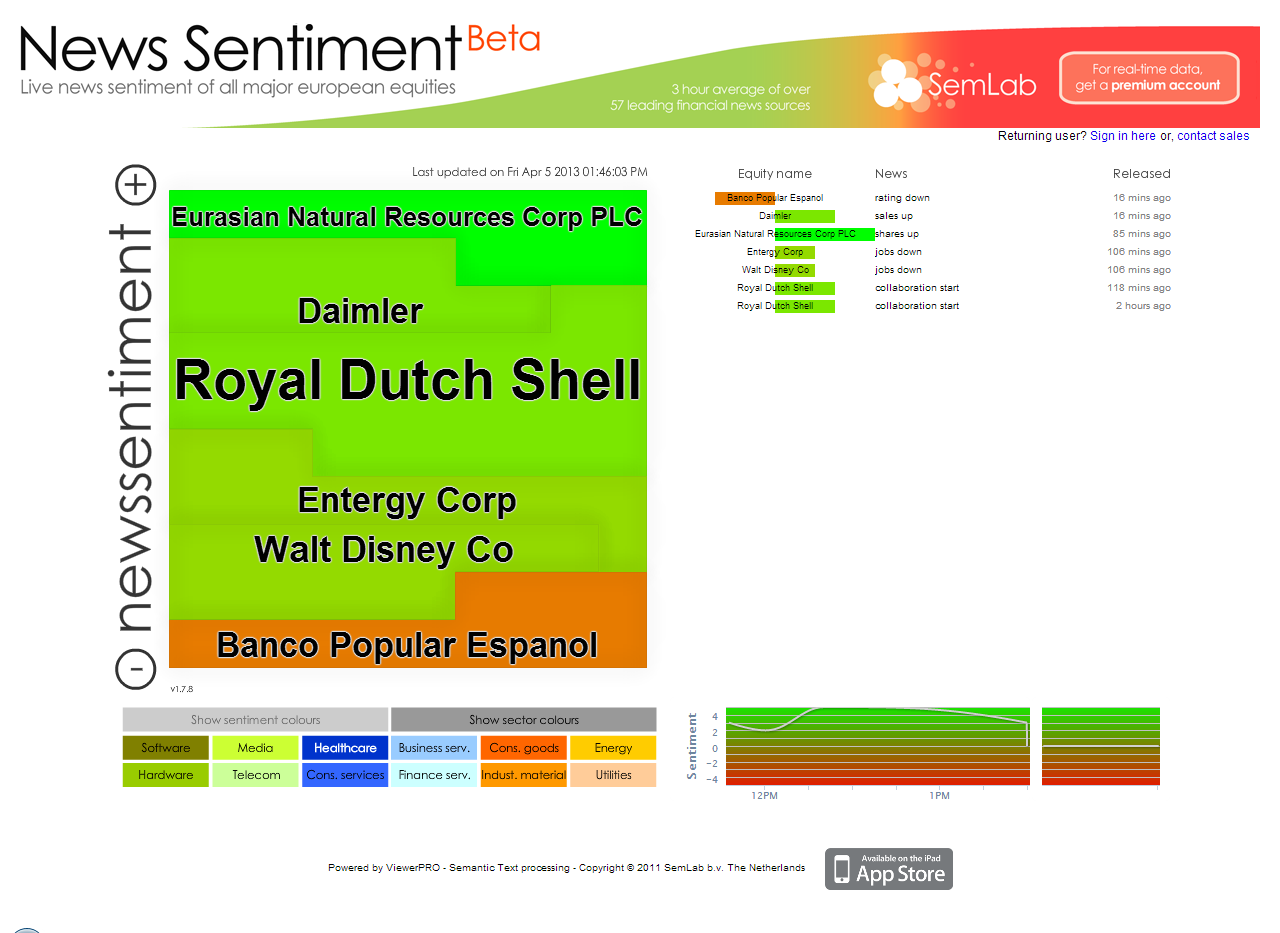
NewsSentiment is provided as a free beta showcase website connected to our ViewerPro semantic processing platform. It provides a graphical display, intended to provide direct insight in the current sentiment of major European equities. It is connected to public web based data of 57 leading finance sources and uses our default finance ontologies to capture the semantics of the breaking news.
The resulting finance events are ranked according to their implicit sentiment on scale of -5 (negative) to 5 (positive). The negative values are visualized as red and the positive as green. Intermediate values are displayed as colors shades between red via orange to green. The most positive equities are positioned top-left whereas the most negative are bottom-right.
The size of the tile in the image is determined by the number of times a specific equity is mentioned in the three hour time window. This size is a measure of the “presence” of a specific company in the news.
The website further displays a list of the events and the time at which they occurred and a graph displaying the average market sentiment over the last few hours.
In addition to the red-green sentiment colors, the image can also be displayed using colors indicating the sector of the equities. Using the buttons below the image, specific sectors can be filtered to visualize the relative sentiment in the entire sector.
A further developed version of this functionality using generally the same data is described here and available as iPad App in iTunes.
If you have any questions concerning this application or our technology in general, don’t hesitate to contact us.
 Live NewsSentiment